Visualizing a request state in Kibana during registry operation
1. View
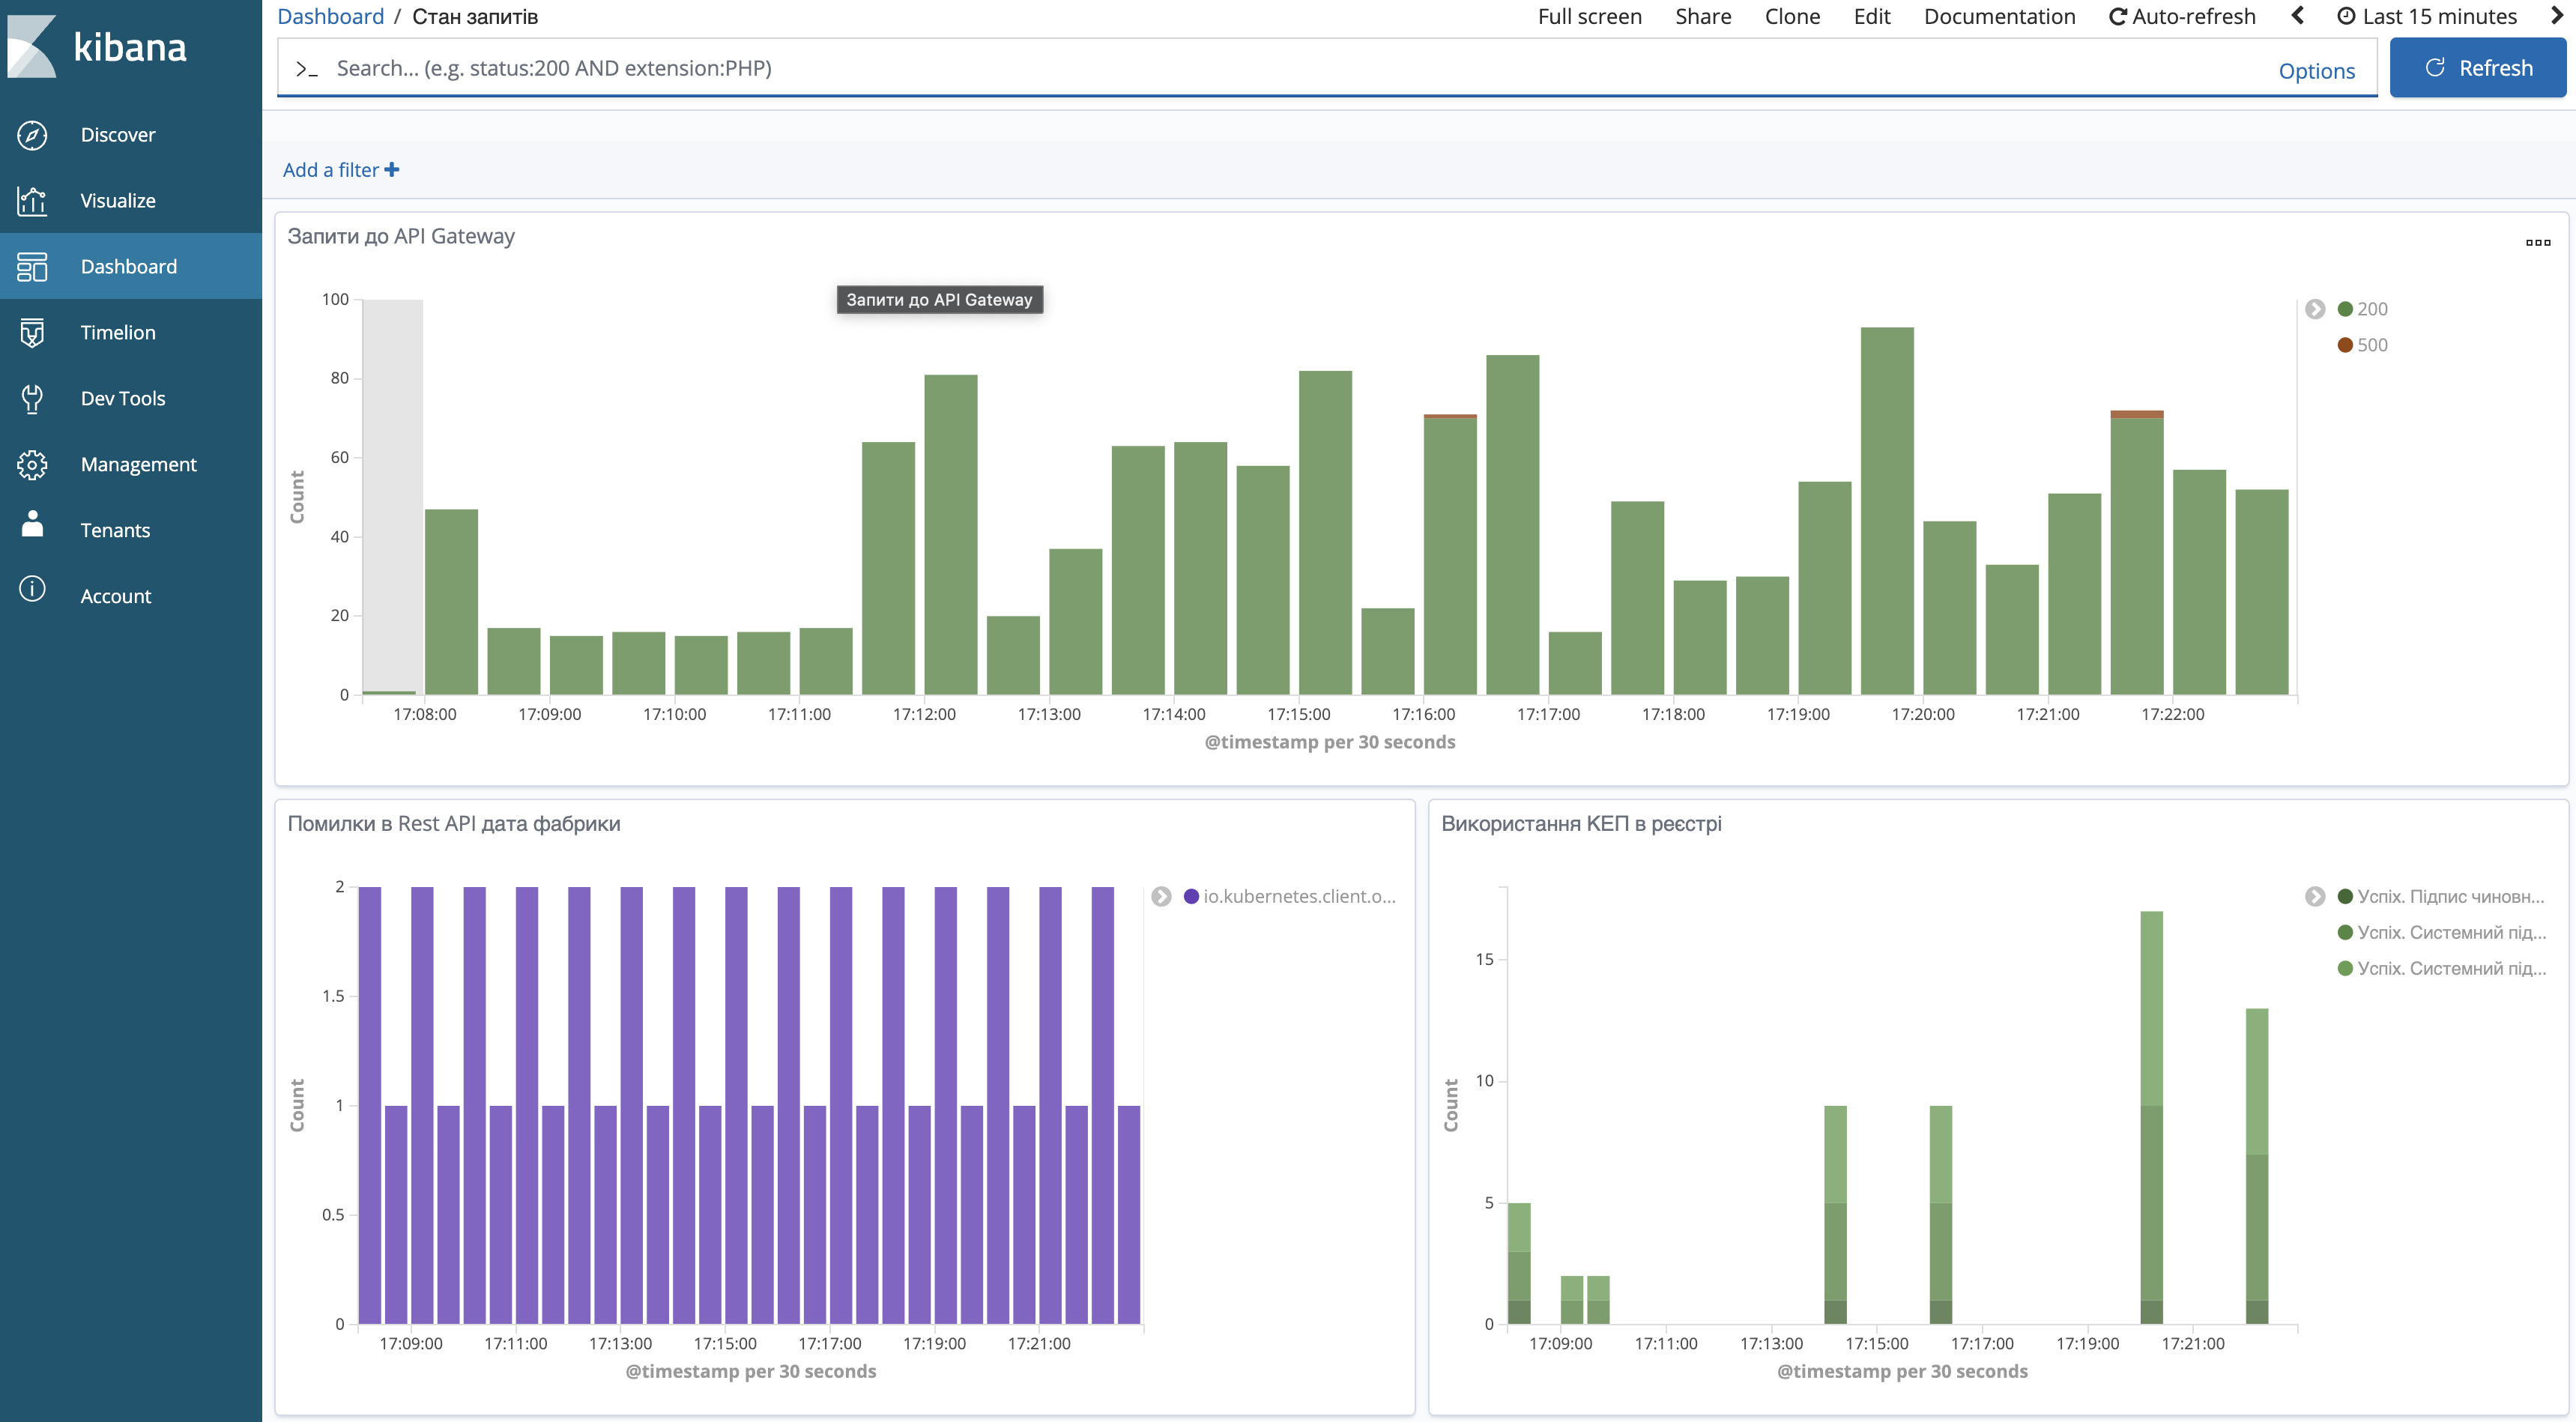
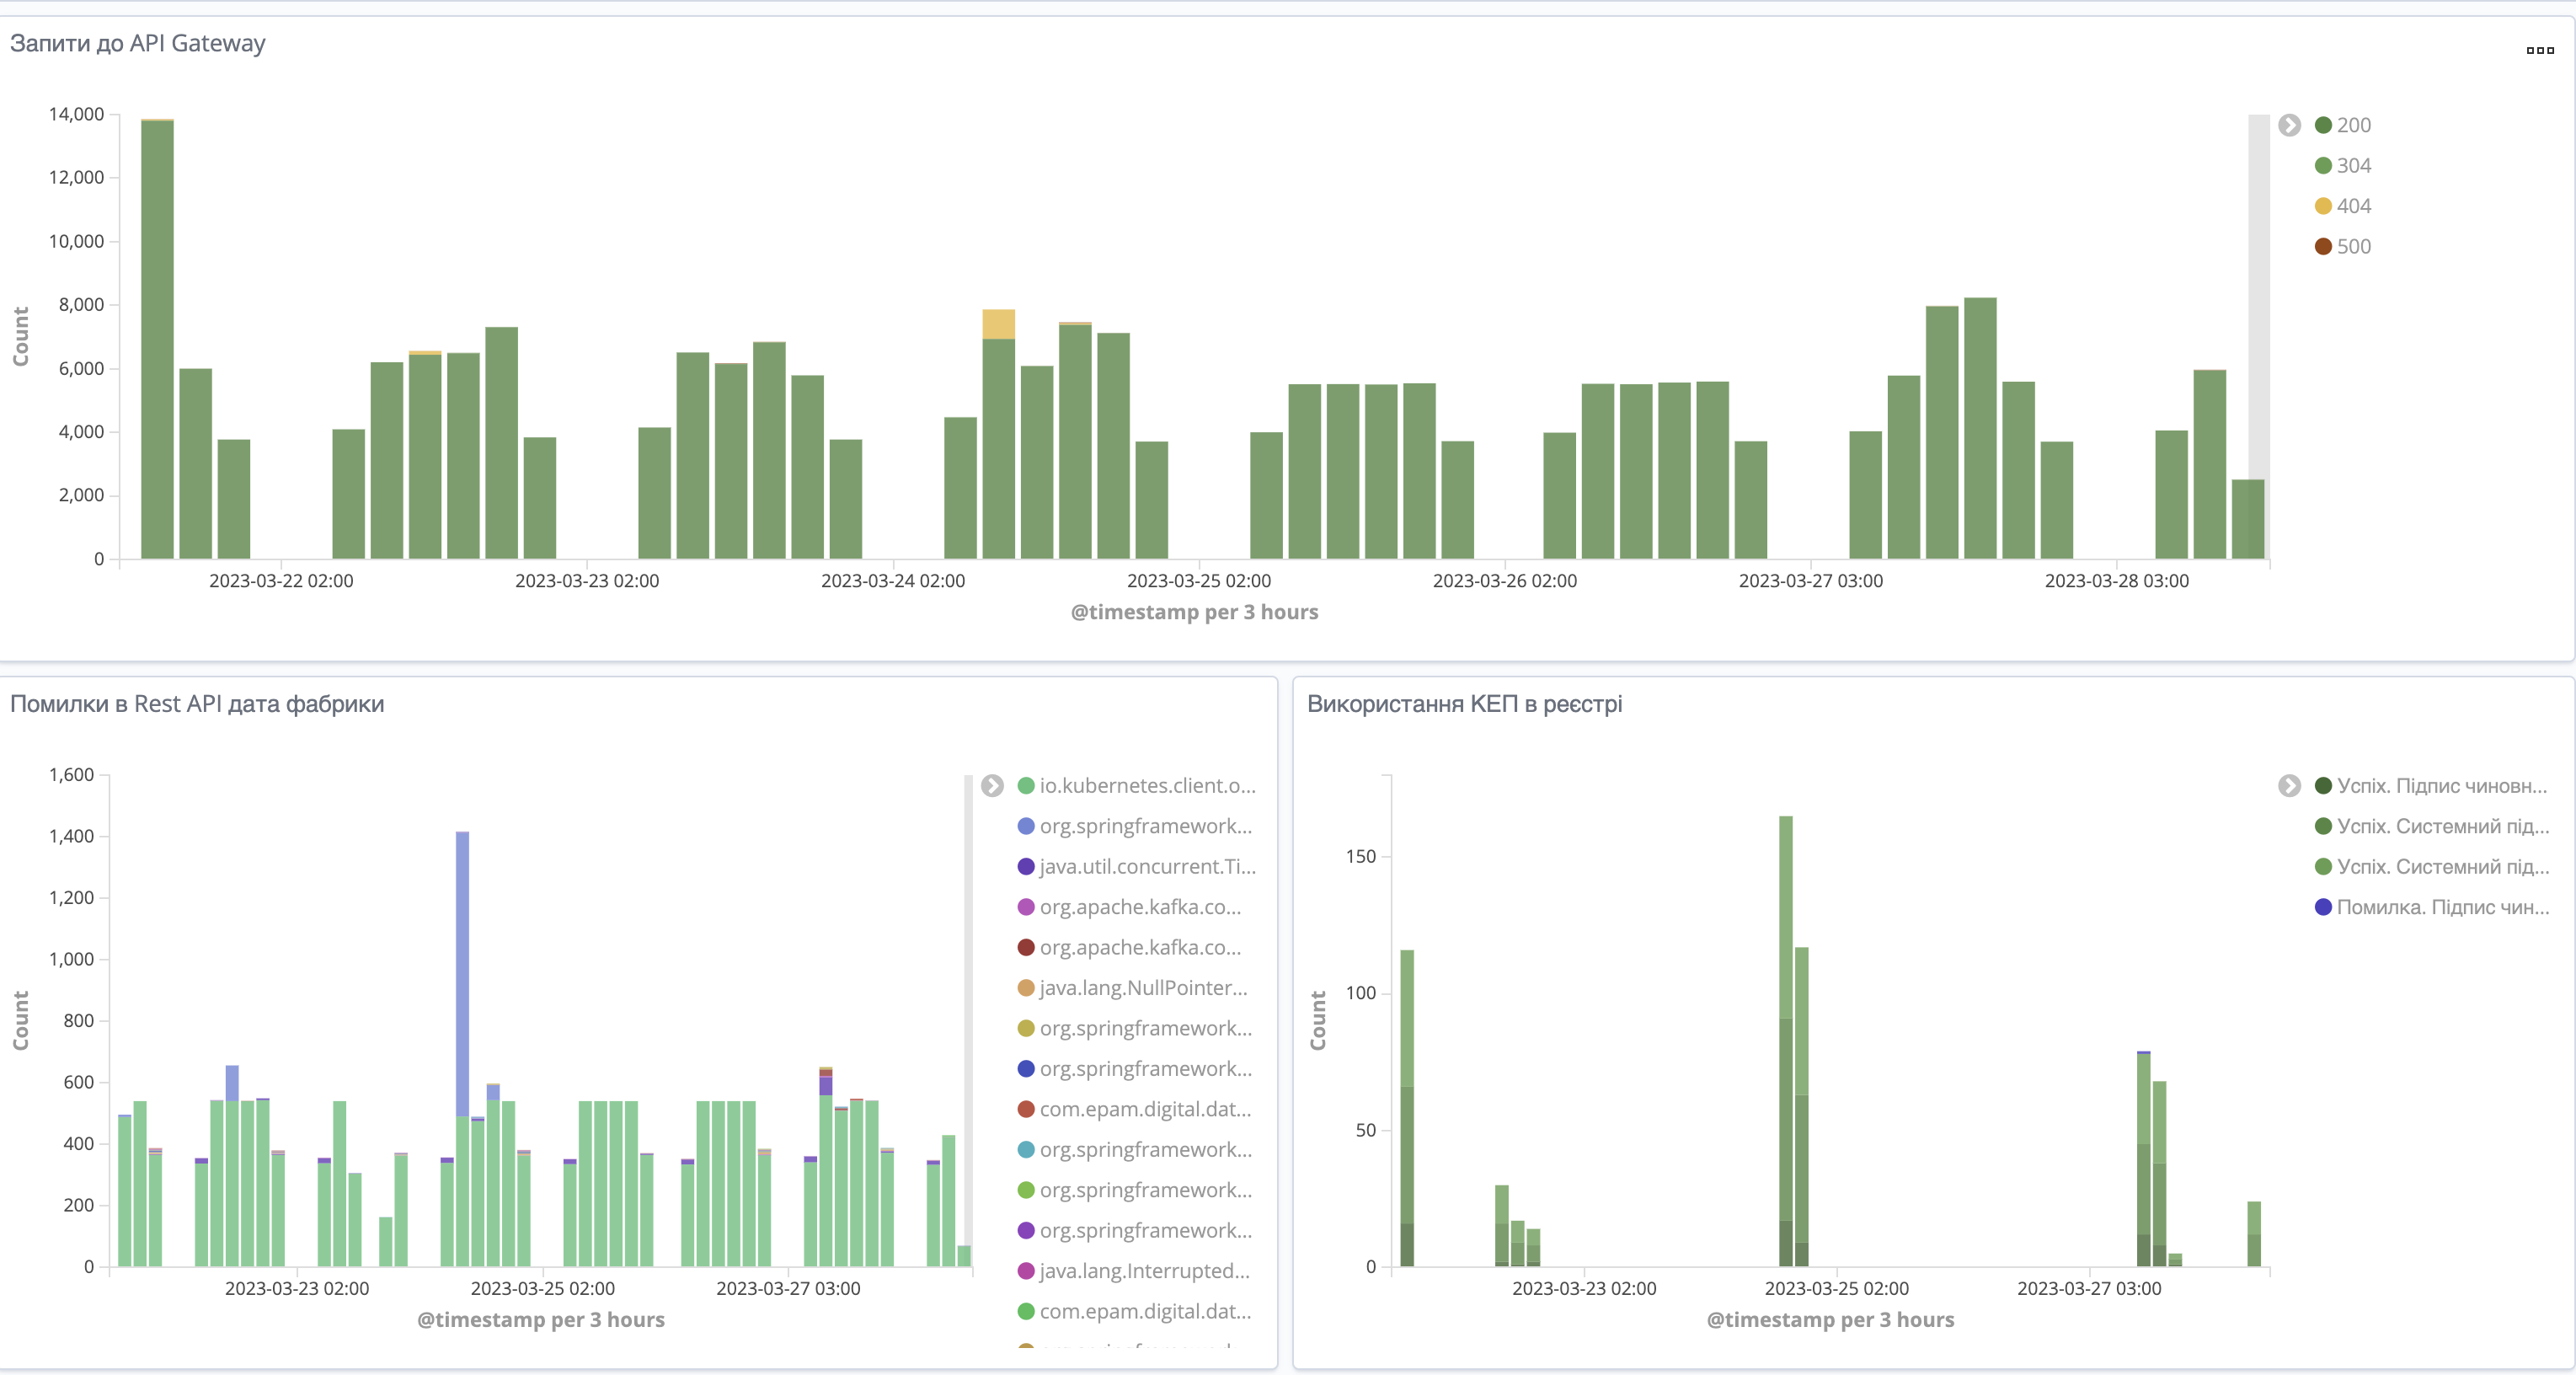
This dashboard provides an overview on registry operation, including external requests execution states, among others. It contains the following visualizations:
- Requests to API Gateway:
-
Shows the general number of external HTTP-requests received by the registry.
- Errors in Rest API data factory :
-
Shows the number of errors that appeared during the processing of requests to Rest API data factory.
- Using e-Signature in the registry :
-
Shows the general number of operations conducted in the cryptoservice, with sorting by type and status.
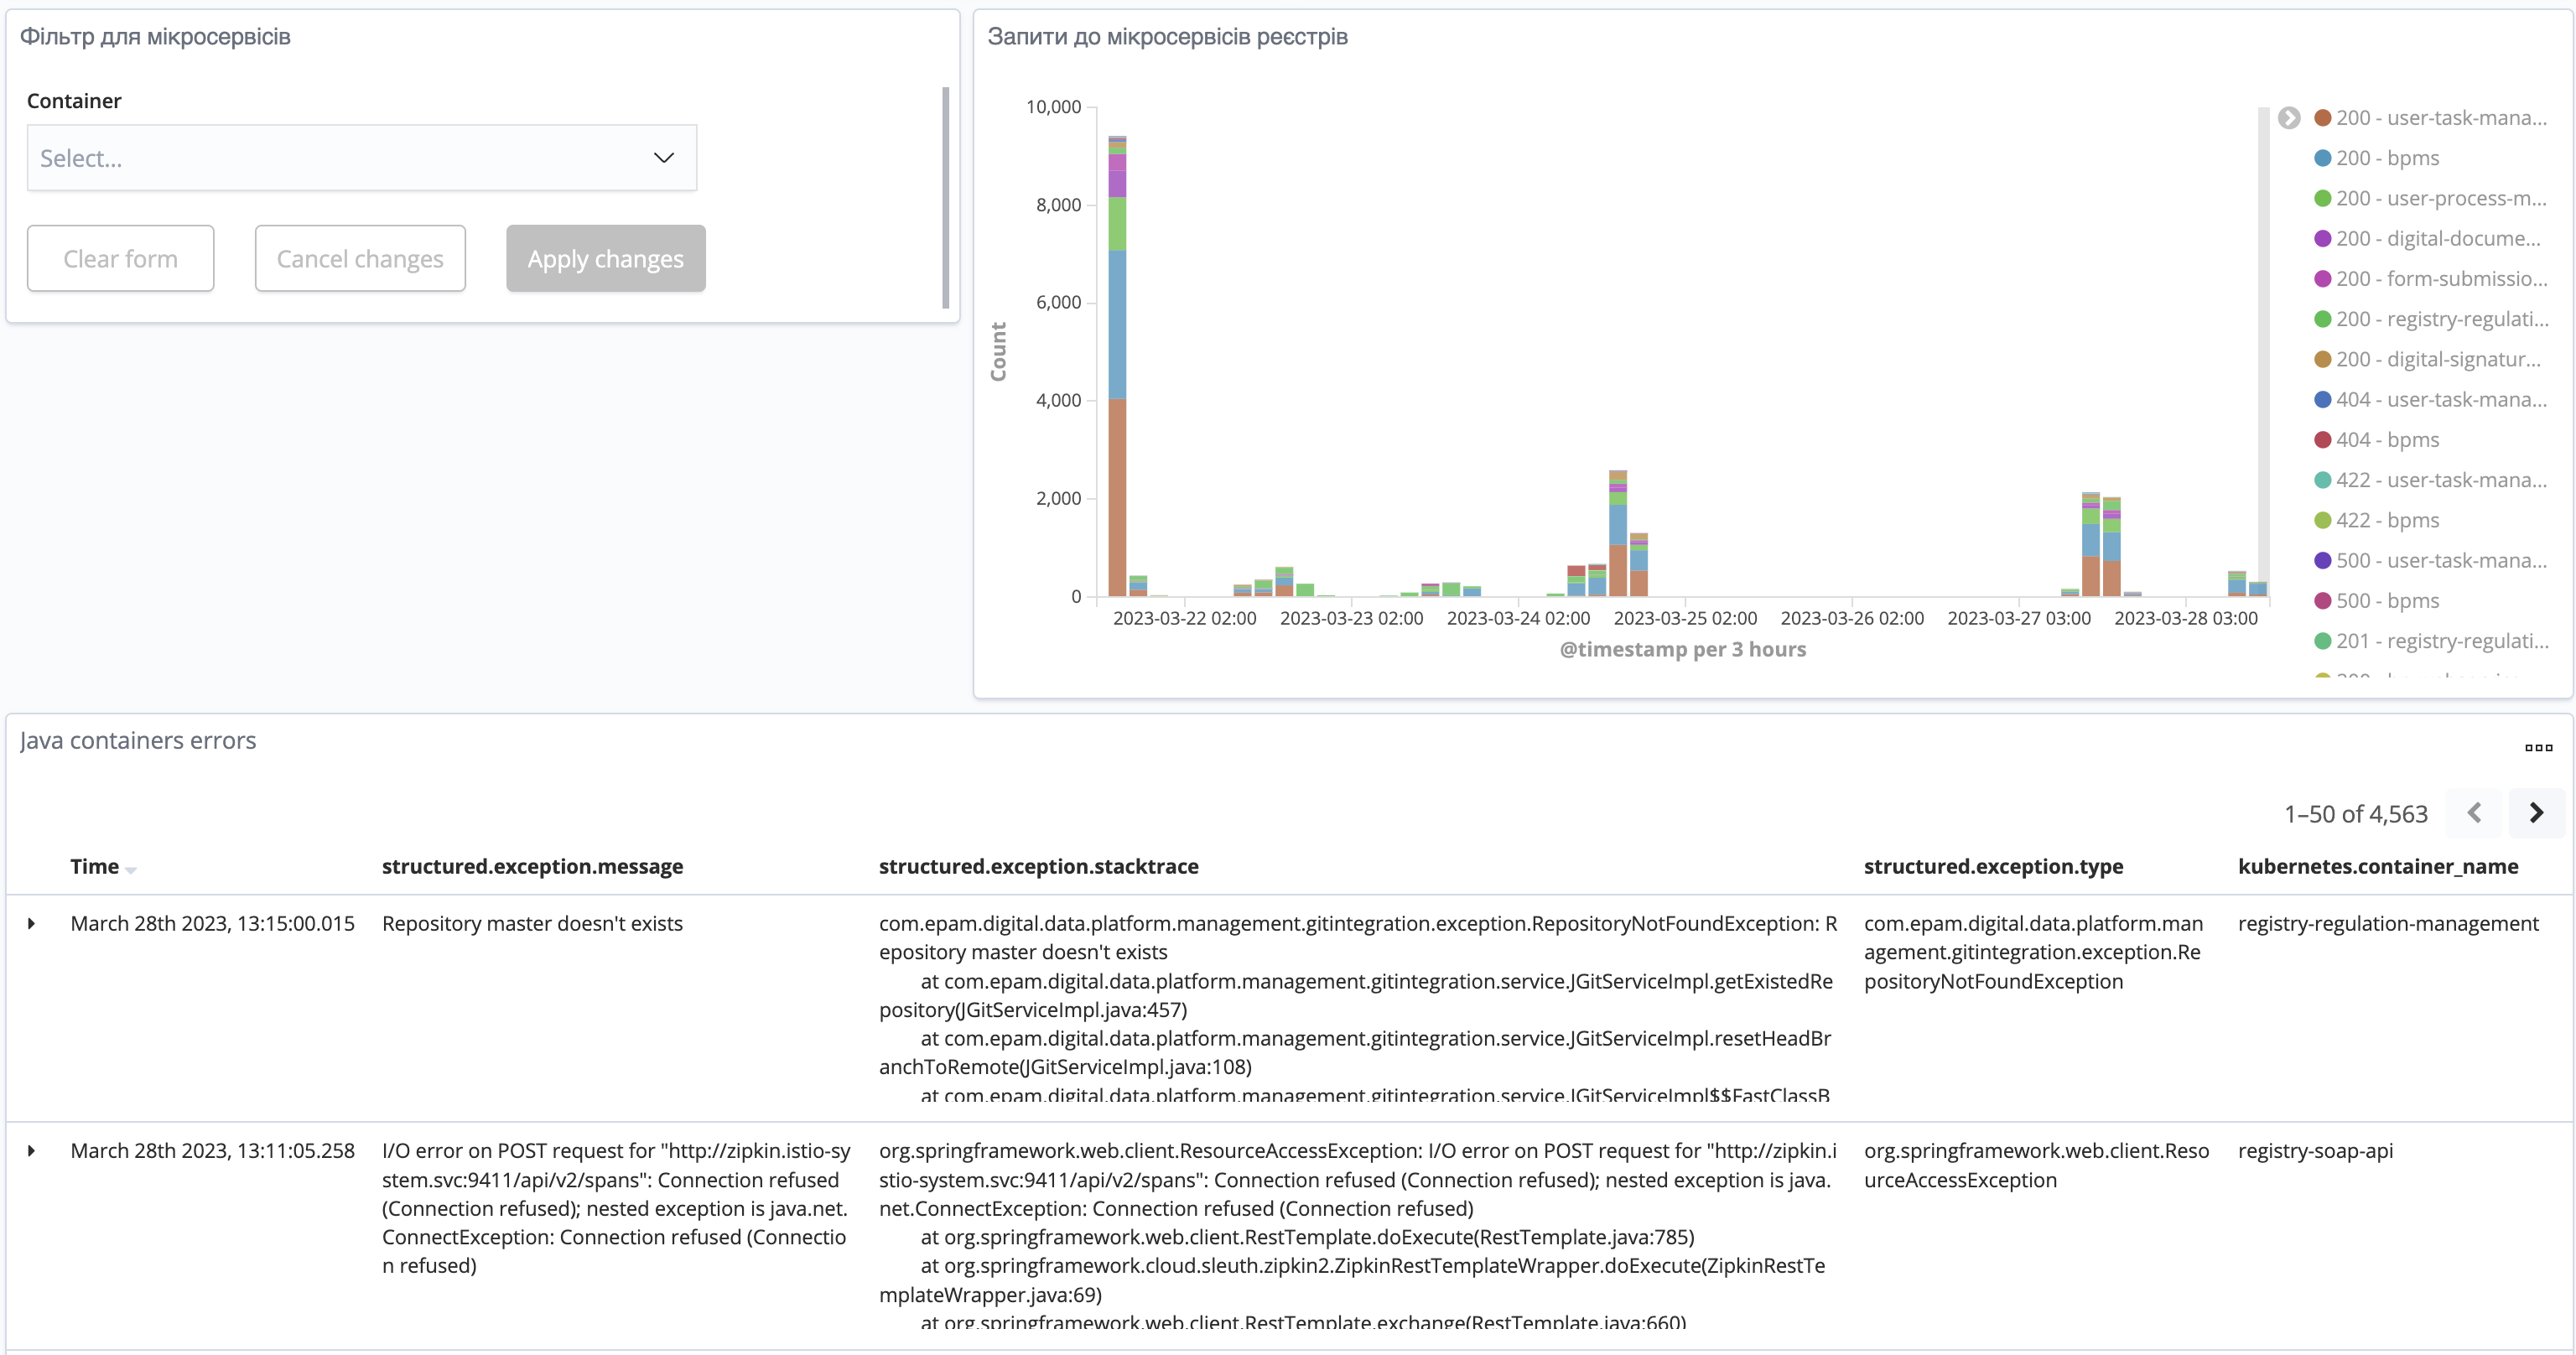
- Requests to registry microservices :
-
Shows the general number of requests to the registry microservices, with sorting by HTTP-code of the response.
2. Configuration
To set up this dashboard, take the following steps:
-
Download the request-dashboard.json file.
-
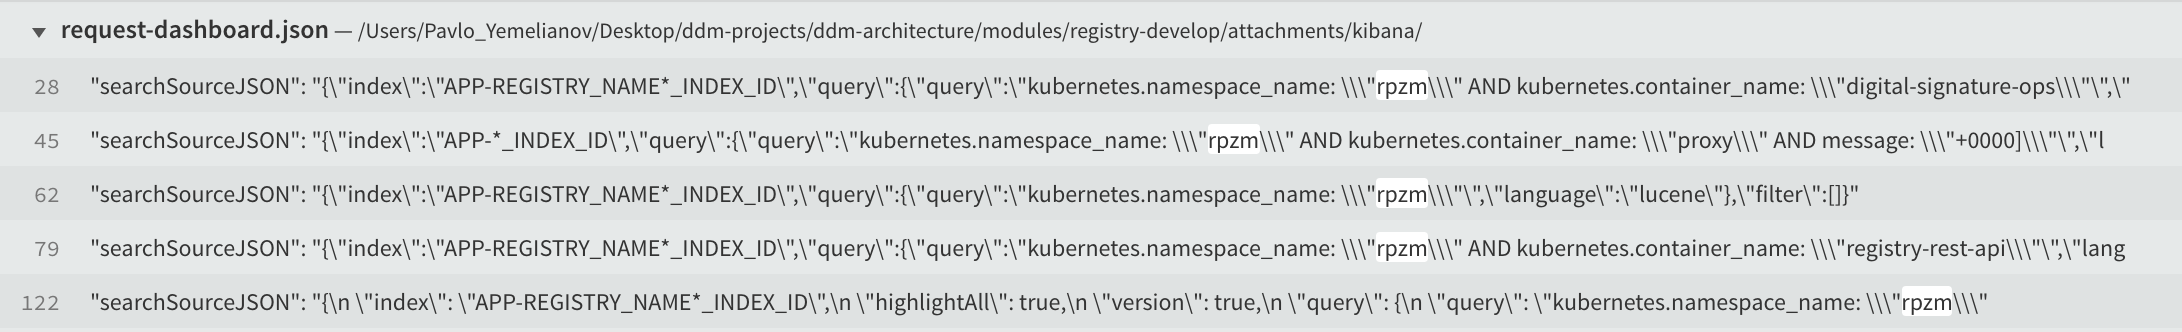
Change all the
YOUR_REGISTRY_NAMEplaceholders (there are 5) in the file to the required registry name in your preferred text editor.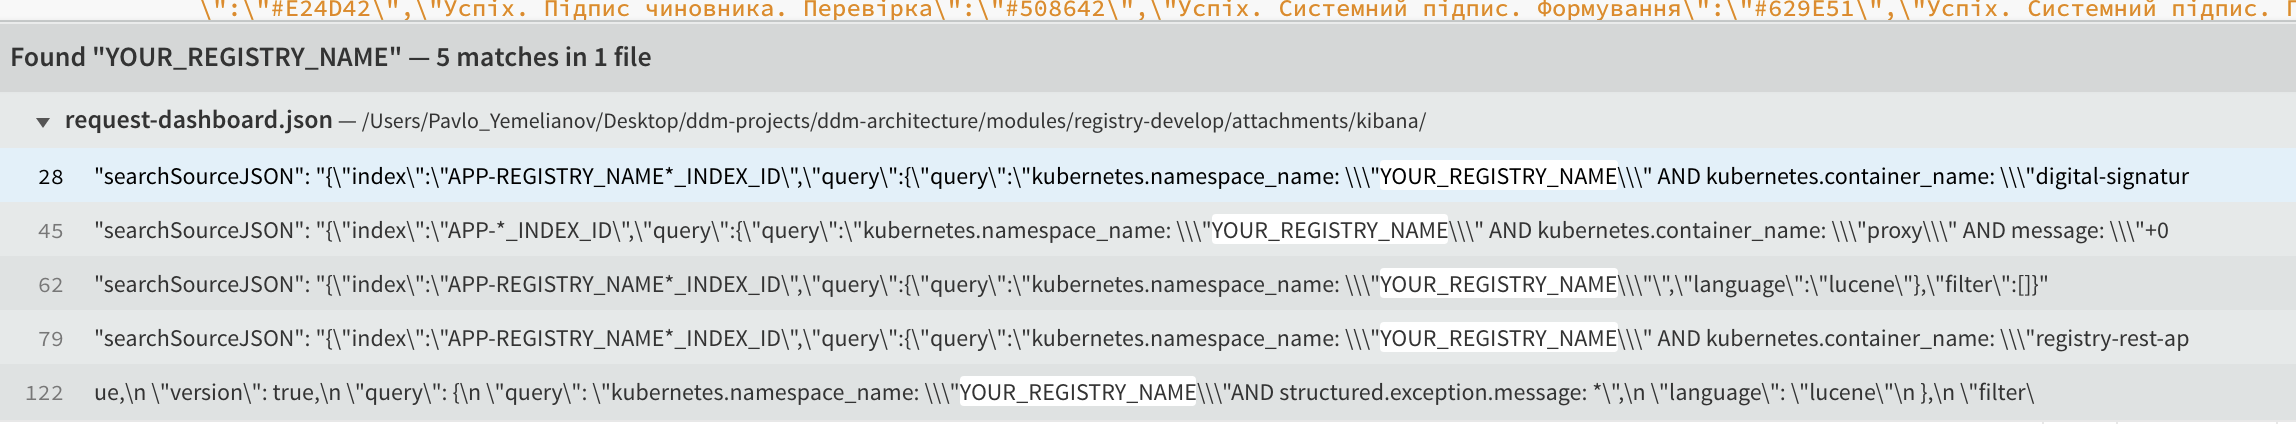

-
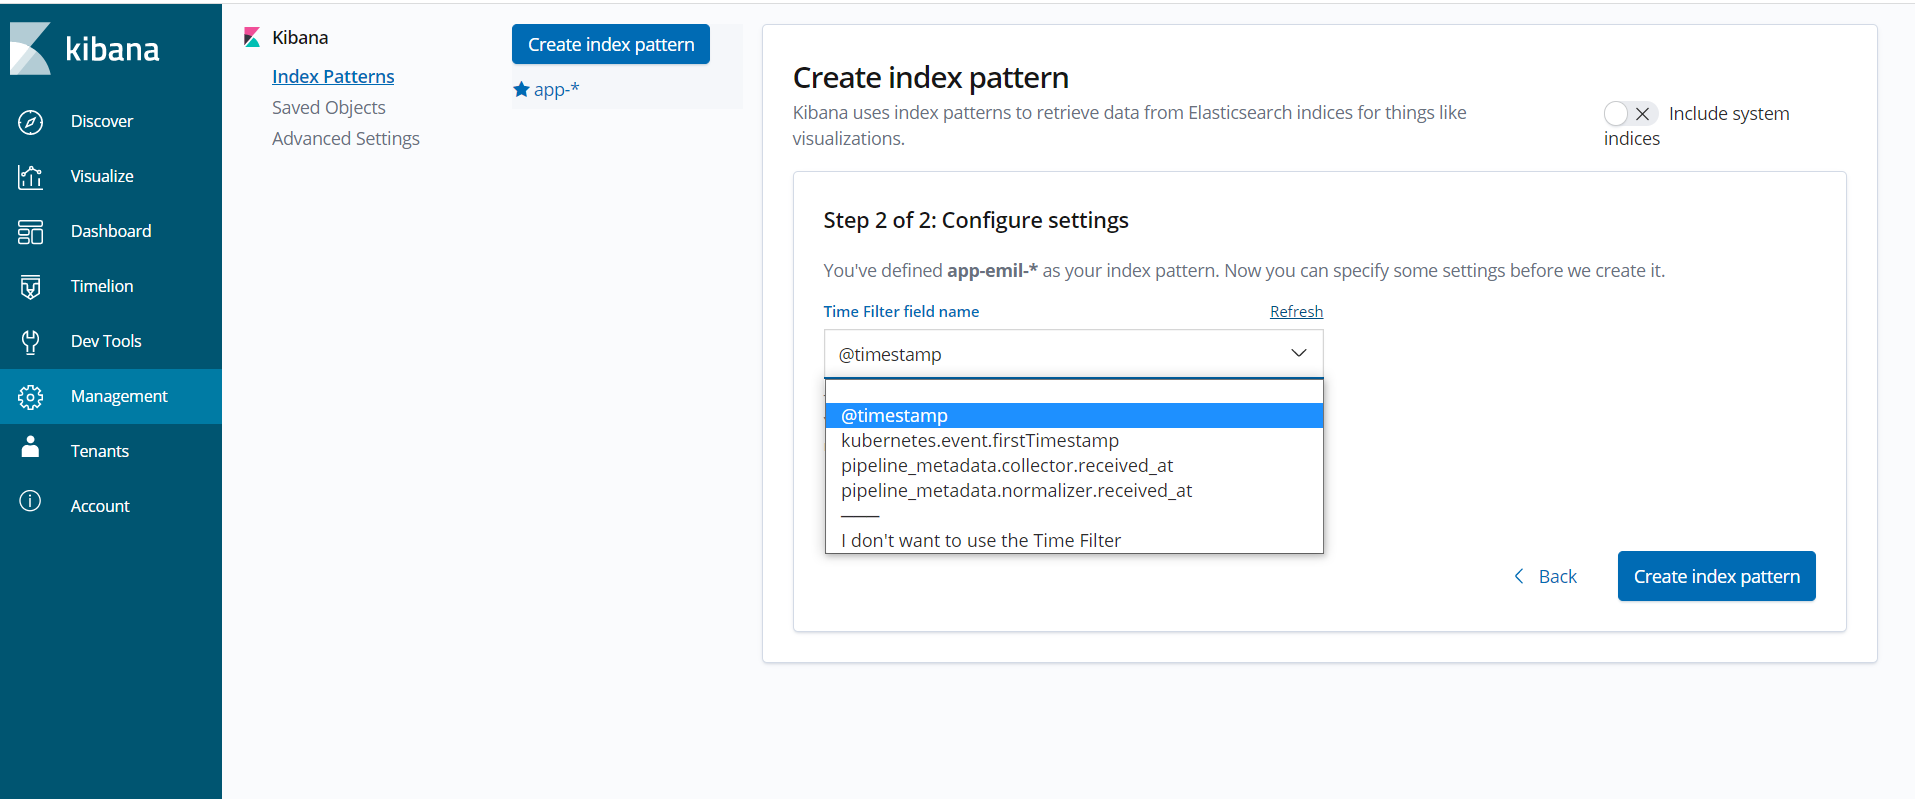
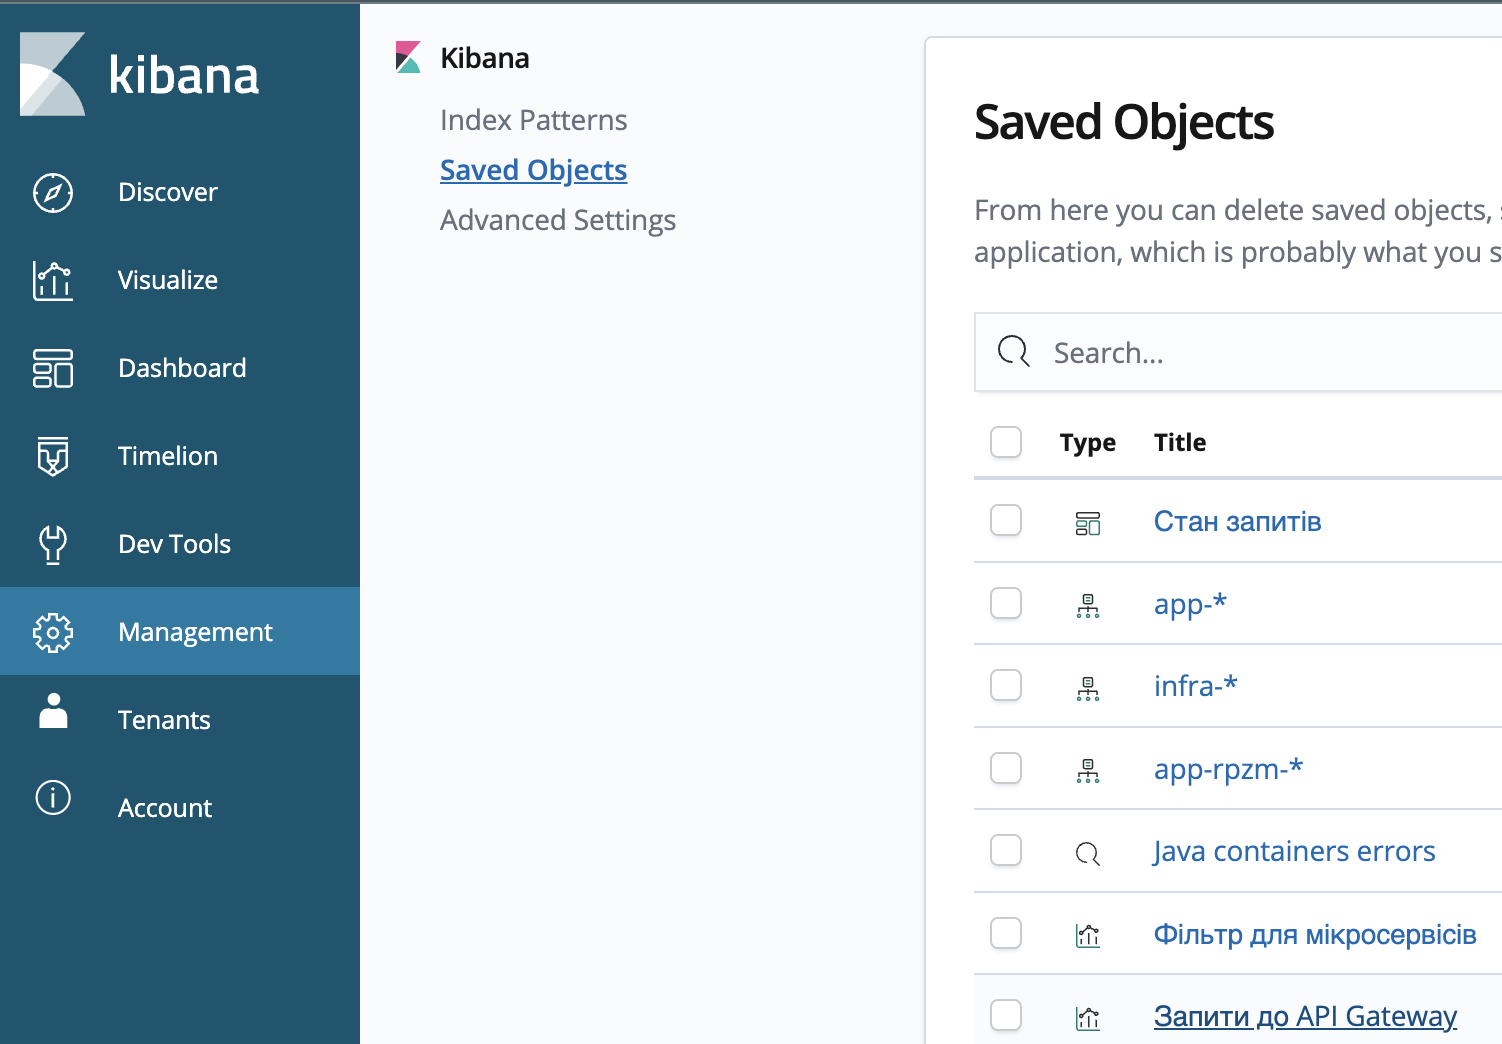
Create 2 index pattern via Kibana web-interface:
app-*andapp-<REGISTRY-NAME>-*.<REGISTRY-NAME>— name of your registry. For example,app-test-registry-*.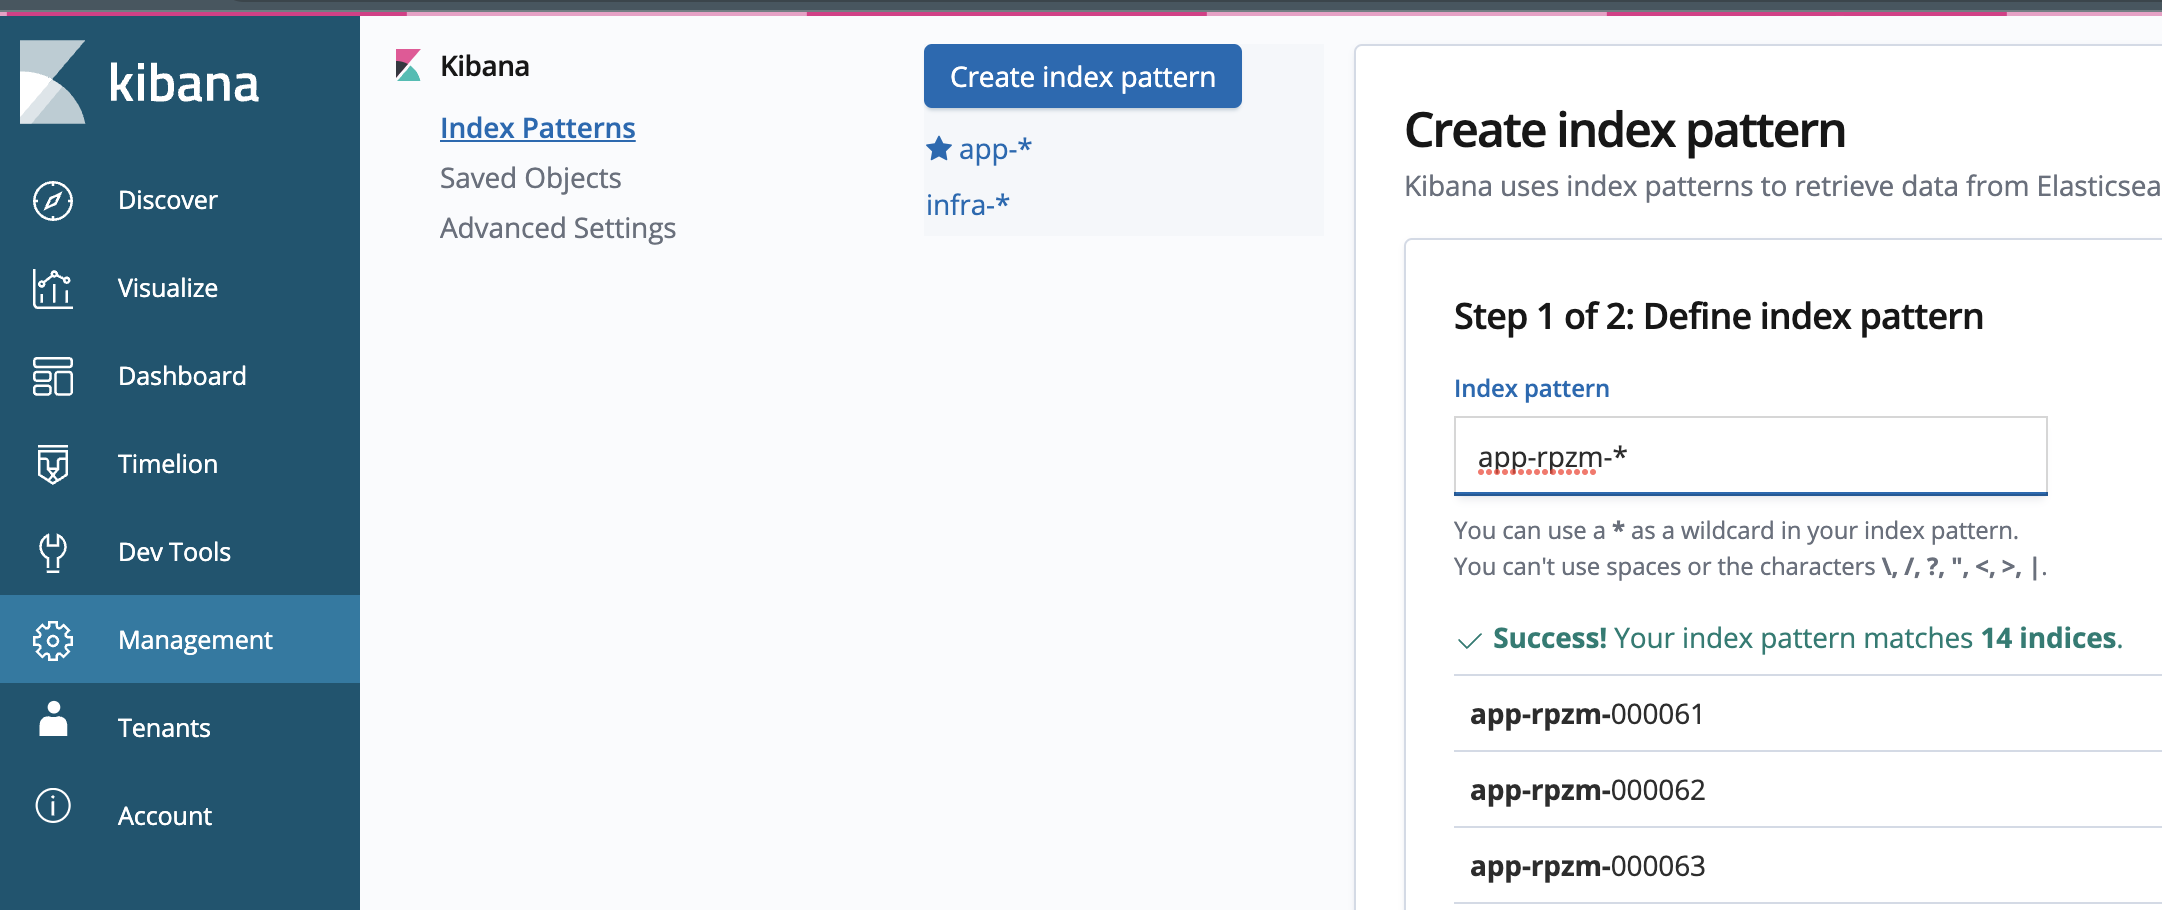
-
Import the prepared file (see step 2) via Kibana web-interface.
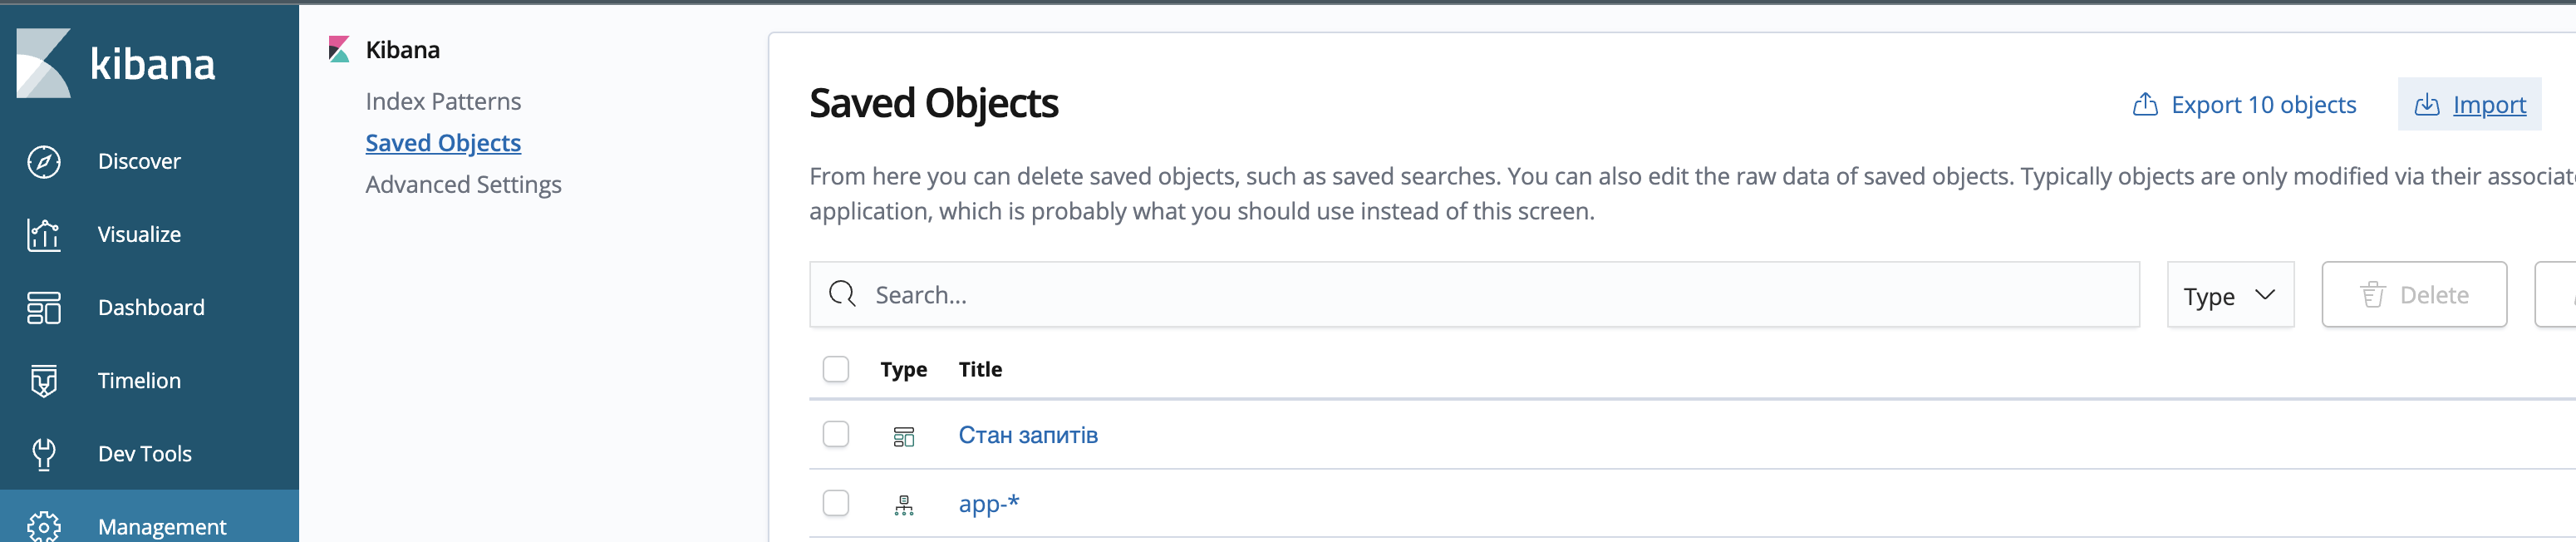
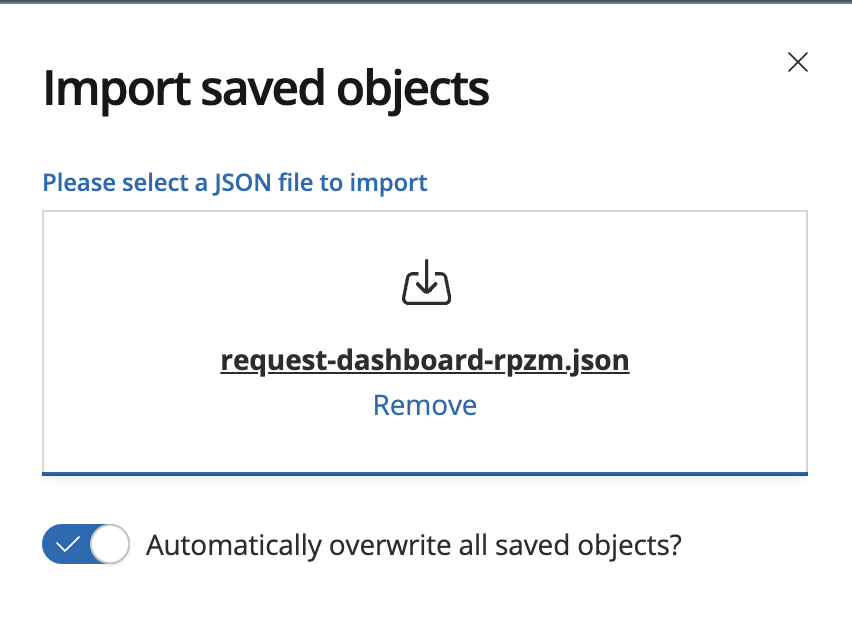
Select the corresponding index pattern for the visualization during the import (
app-REGISTRY-NAME-*).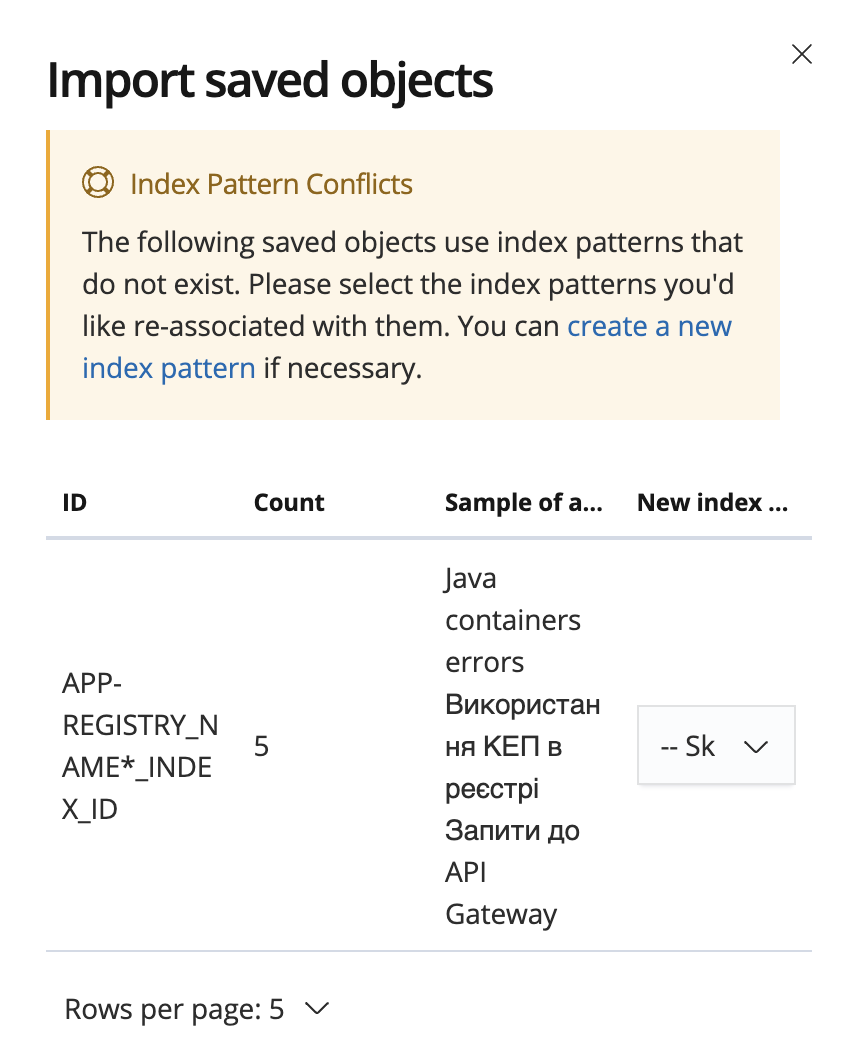
-
Configure the dynamic filter.
For the correct operation of the Filter for microservices , update the
indexPatternID:-
Open the API Gateway requests visualization.
-
Copy the value of index parameter in the
kibanaSavedObjectMeta.searchSourceJSONsection.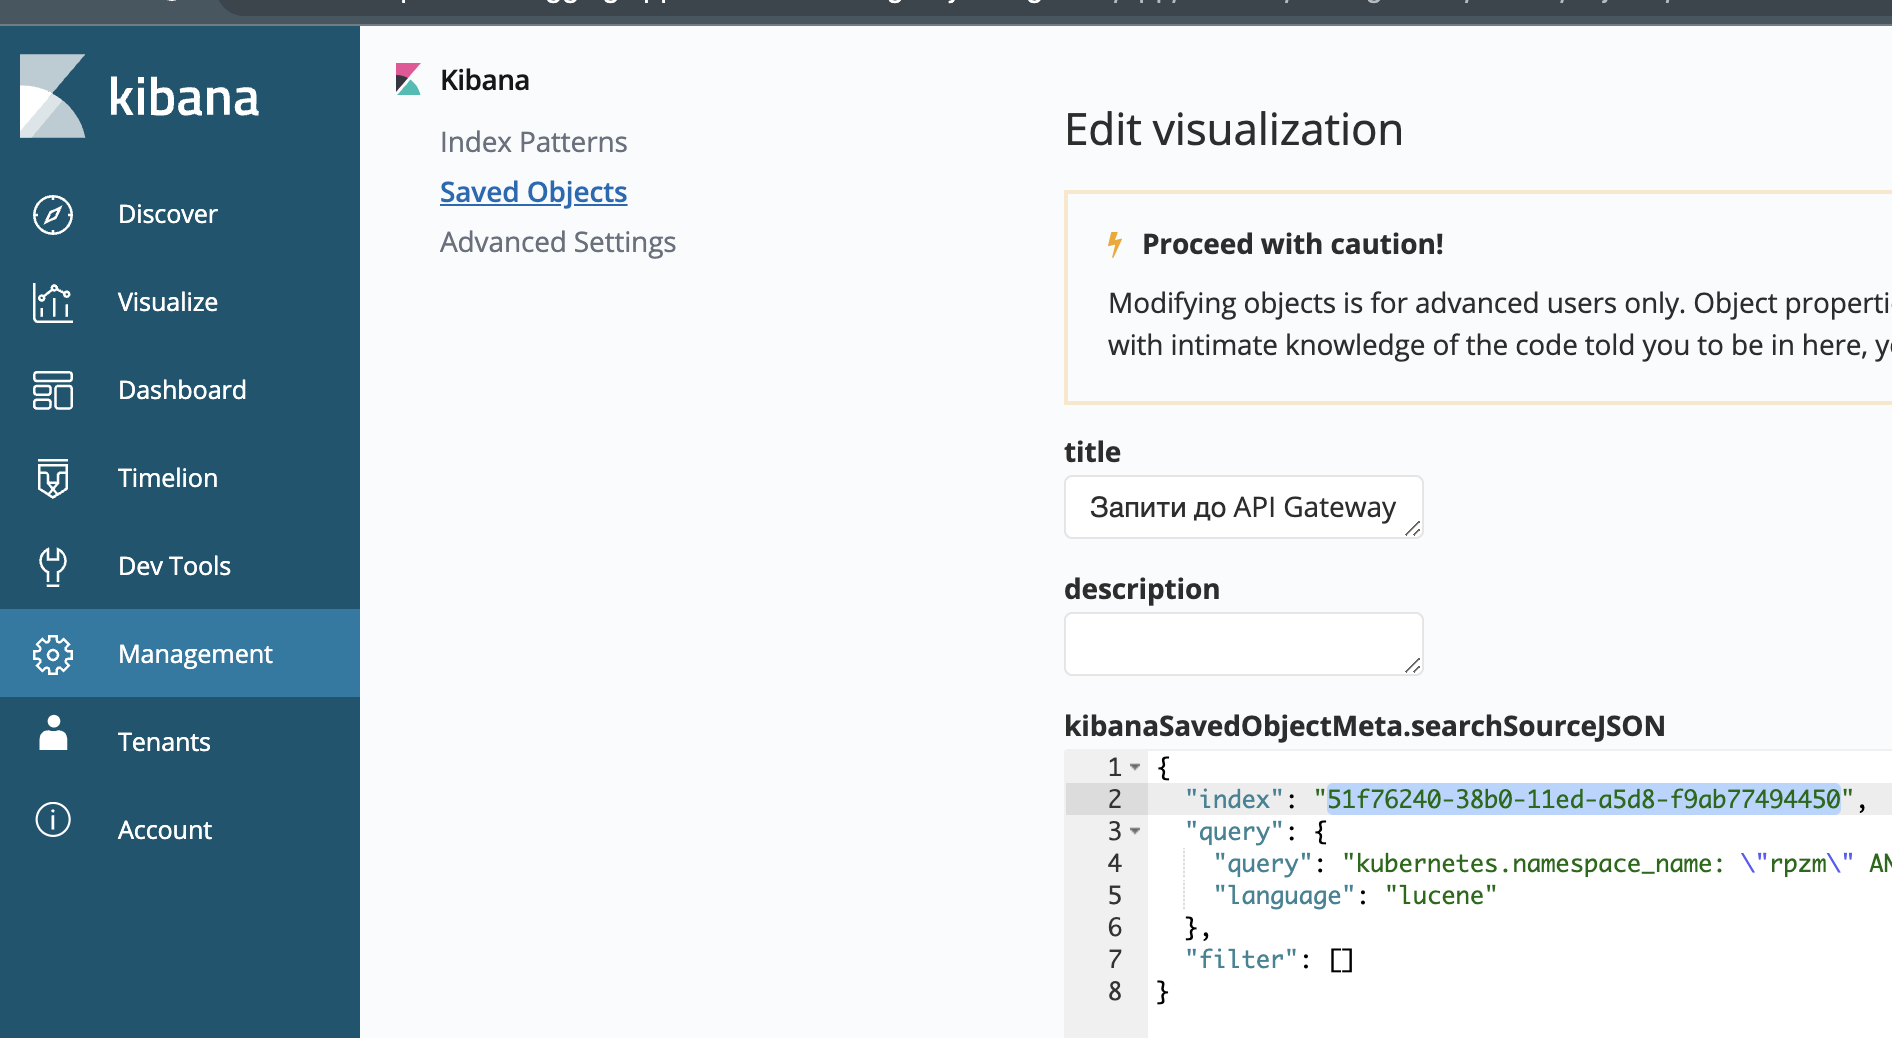
-
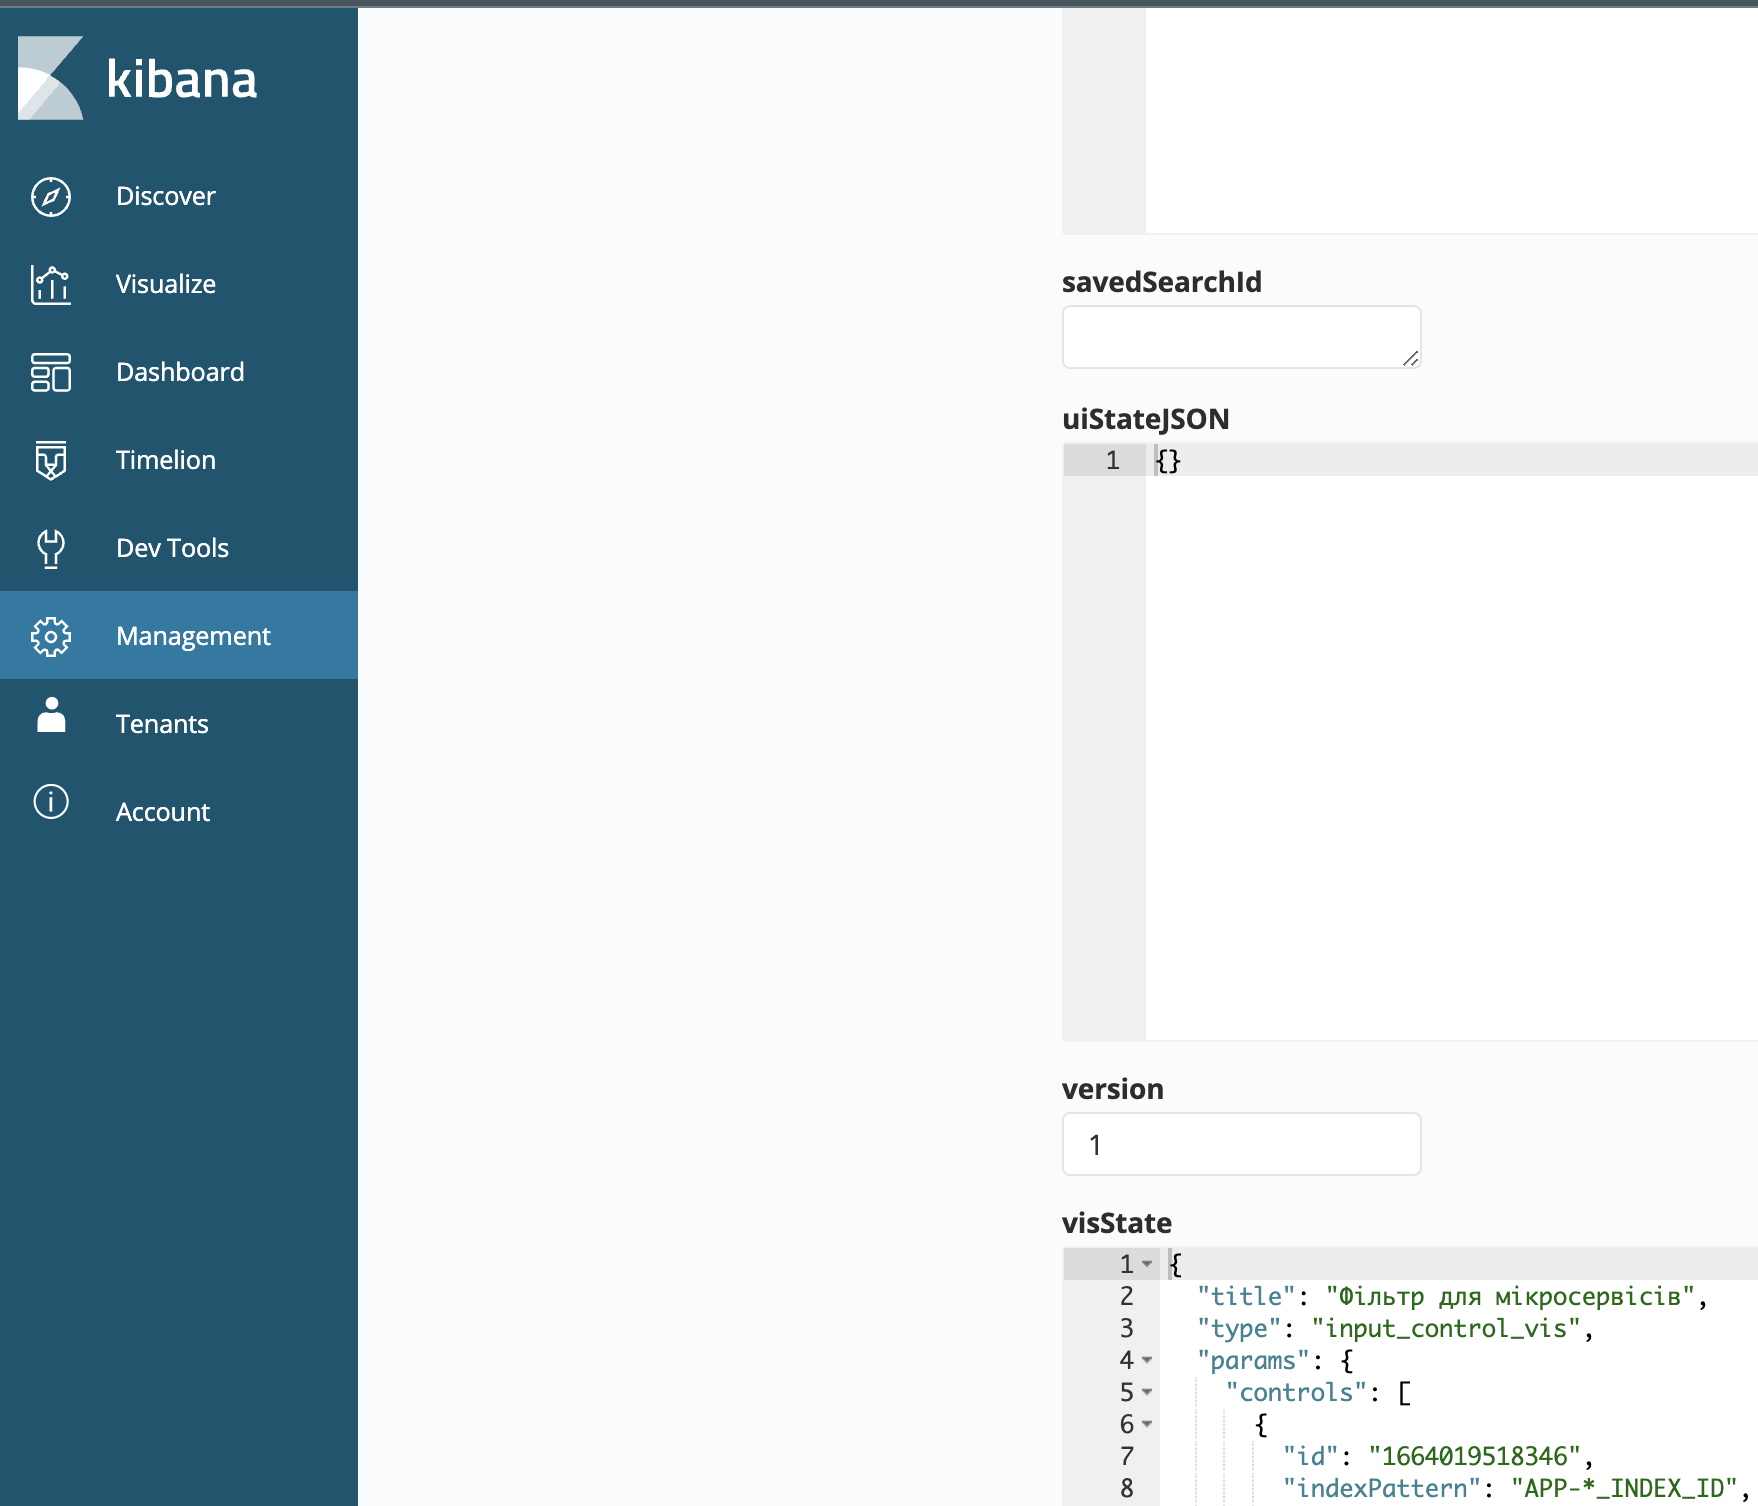
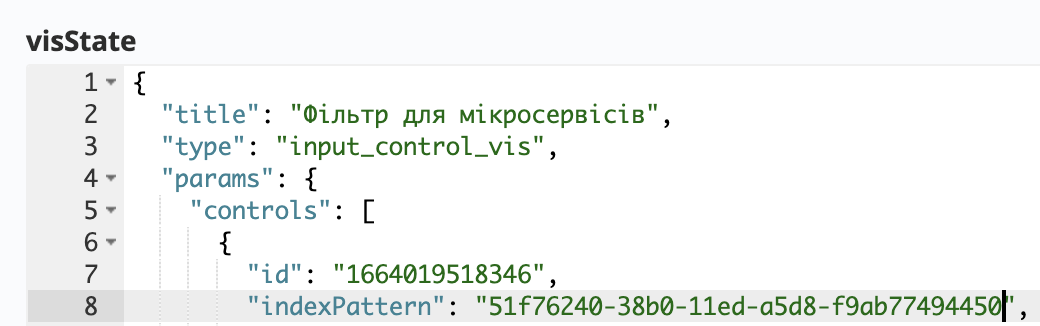
Open the Filter for microservices visualization. and change the value in
visStatesection of theparams.controls[0].indexPatternto the value from the previous point.Default indexPatternvalue:APP-*_INDEX_ID.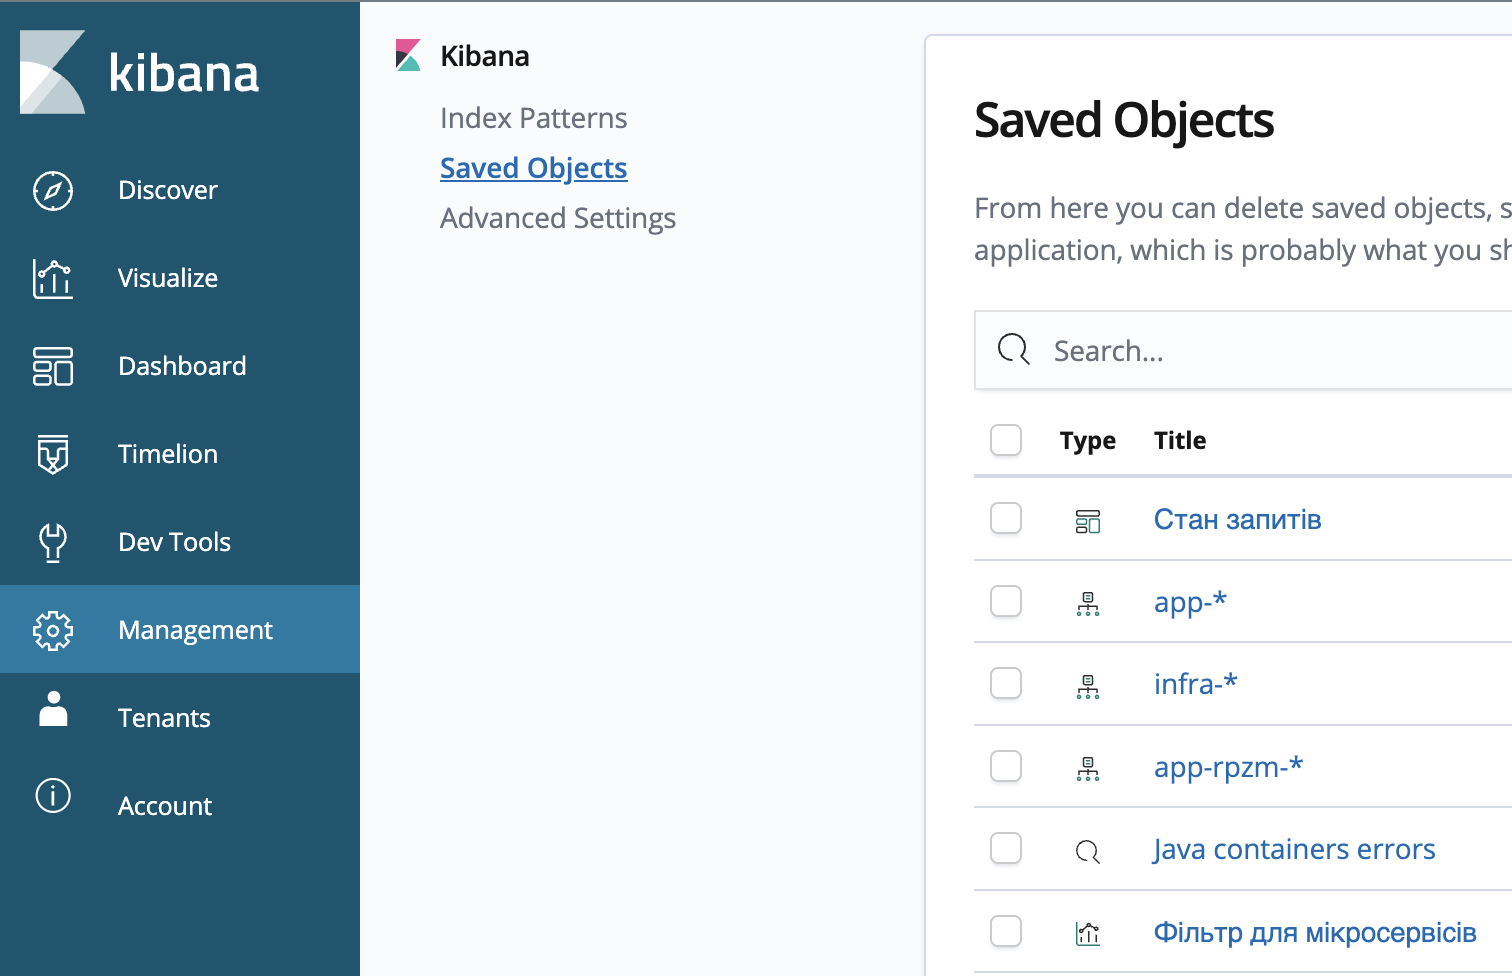
-
-
Press
Save visualization Object. -
In the Dashboard > Requests state section you can view the states of requests, during registry operation.